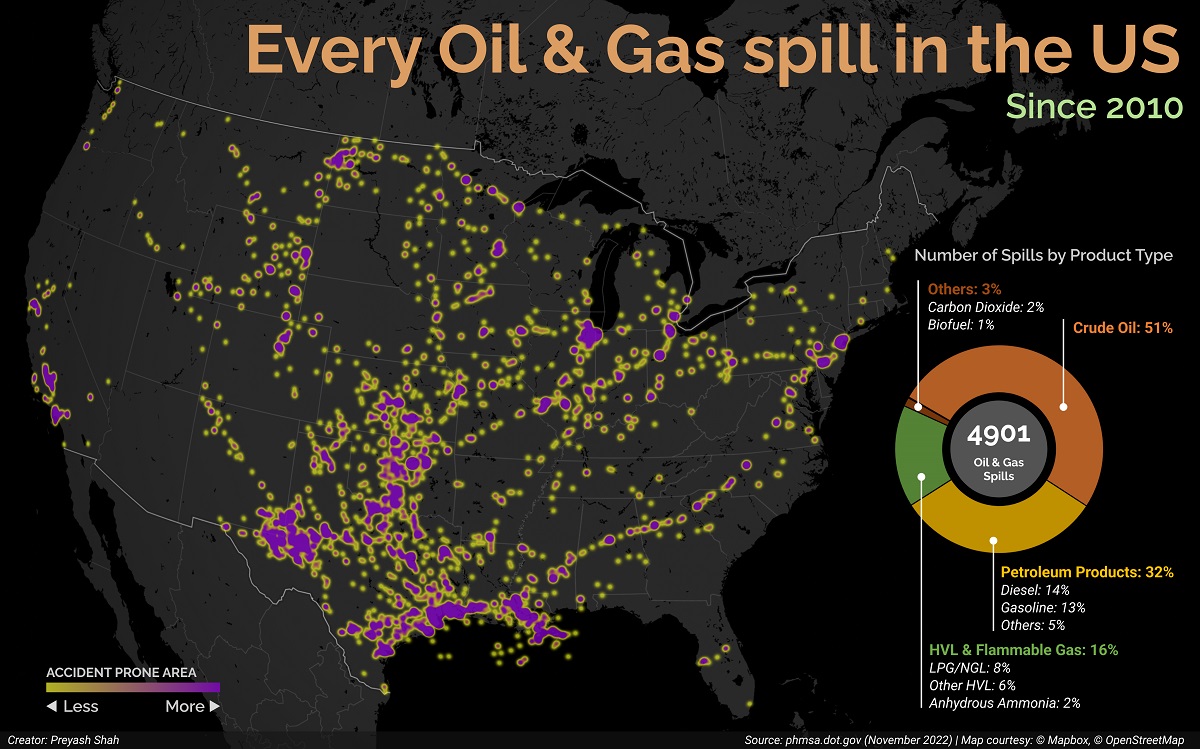
Every oil and gas spill in the contiguous U.S. since 2010. (credits: “Visual Capitalist”)
The recent energy crisis has highlighted the critical role that hydrocarbons play in powering the modern world, but these fossil fuels still have their drawbacks.
Aside from the obvious climate impact, another disadvantage is spills, which can cause ecological and economic damage. Pipeline leaks, train derailments, and other industrial disasters can all cause this.
U.S. Oil and Gas Spills (2010‒2022) #
The majority of spills that have occurred come mostly from crude oil, followed by petroleum products and gas. Note that this data covers the quantity of spills and not damages or volume.
| Spills by Product Type | Portion of all U.S. Spills |
|---|---|
| Crude oil | 51% |
| Petroleum products | 32% |
| Diesel | 14% |
| Gasoline | 13% |
| Others | 5% |
| Highly volatile liquids & flammable gas | 16% |
| Liquefied petroleum gas / natural gas liquids | 8% |
| Other highly volatile liquids | 6% |
| Anhydrous ammonia | 2% |
| Others | 3% |
| Carbon dioxide | 2% |
| Biofuel | 1% |
Data figures add to 102% due to rounding errors, bolded figures represent the sum of subcategories
Crude oil, which accounts for slightly more than half of all documented spills, is also one of the most expensive. Contaminations can linger for years after a spill, with particularly severe consequences for local mammals and waterfowl.
This was the case with the Deepwater Horizon spill (also known as the “BP oil spill”), which is still causing problems in the Gulf of Mexico, according to experts.
Petroleum products such as diesel or gasoline, as well as liquefied natural gas or other volatile liquids, are also frequently spilled. Interestingly, liquefied carbon dioxide can be transported in pipelines, which are commonly used for carbon capture and storage, but it requires high pressure to keep its state.
Looking at the locations of spills, it’s clear that the South Central states have had the most disasters. In comparison, the West Coast has seen significantly less activity. However, when looking at the dominant oil producing states, where Texas and its neighbours reign supreme, this makes much more sense.Search:
| Rank | State | Oil & Gas Spills (2010-2022) |
|---|---|---|
| 1 | Texas | 1936 |
| 2 | Oklahoma | 407 |
| 3 | Louisiana | 297 |
| 4 | California | 253 |
| 5 | Kansas | 208 |
| 6 | Illinois | 181 |
| 7 | Wyoming | 155 |
| 8 | New Jersey | 128 |
| 9 | New Mexico | 114 |
| 10 | North Dakota | 98 |
Texas is responsible for 1,936 of the 4,901 spills during this time period, accounting for roughly 40% of all oil and gas spills. Oklahoma is next, with 407 spills and being one of the country’s largest net exporters of oil and gas.


